Several ERP reporting trends have emerged following the release of Acumatica R2 2022 and other late-year software releases. Deloitte‘s ERP trends report includes several interesting items, such as data visualizations and predictive analytics.
Data Visualizations
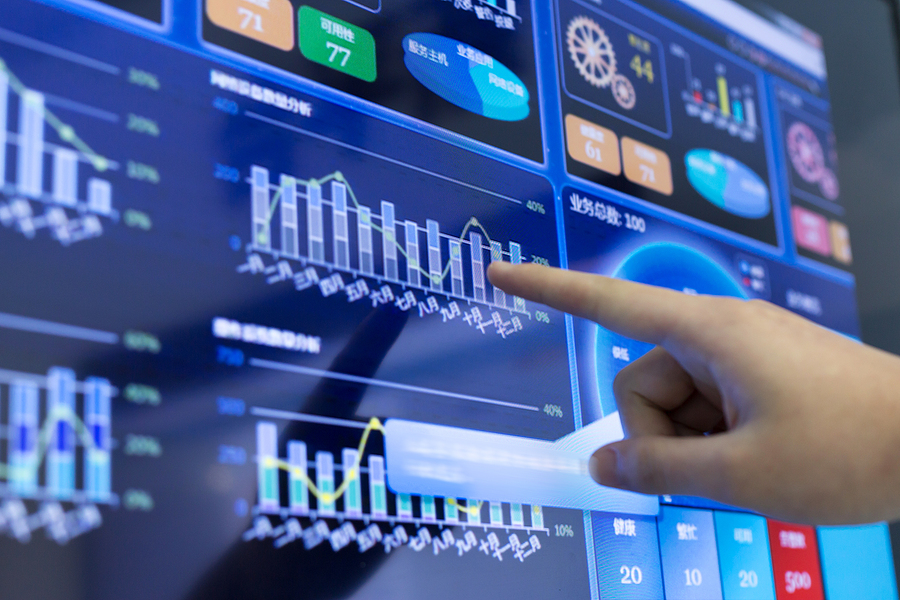
Visualizing data makes numbers more meaningful. In data visualization, numbers are represented as images rather than long lists. An excellent example is sales data, which can be transformed into pie charts showing sales by category or line graphs showing trend lines.
ERP Reporting Trends That Align with Data Visualizations
Mobile data displays are emphasized. Earlier this year, Acumatica R2 2022 updated its mobile app to ensure that it mirrored a user’s dashboard on mobile devices. As a result, other companies are making their data visualizations just as accessible on mobile as on computers.
Easy drag-and-drop tools for creating data visualizations. With drag-and-drop features becoming more common in everything from productivity software to image-enhancing software, it makes sense that ERP reporting trends would incorporate this feature. The drag-and-drop feature is available in many data visualization programs and ERP systems.
User-specific dashboards. Users can customize the dashboards based on their roles and preferences. Data reports do not come in a single layout, so why should dashboards? User-specific dashboards improve usability and productivity by displaying data appropriate to their role.
Predictive Analytics
Predictive analytics also intersects with ERP reporting trends in some ways.
Easy plug-and-play: One of the most exciting ERP reporting trends is the ease with which anyone can use predictive analytics. A few years ago, companies had to hire specialized coders to build scripts to run predictive analytics programs. Today, many ERP systems include some form of predictive analytics.
Predictive analytics has moved beyond the ubiquitous autocorrect into ERP systems. You can use these systems to finish your words; they seem to improve over time. To offer more accurate and fine-tuned predictive responses, many systems use artificial learning, which recognizes patterns in what the user types.
Predictive analytics has become easy to integrate into ERP systems. Predictive analytics has evolved quickly from an uncommon feature to a common and highly desirable feature in ERP reporting, demonstrating their power to help improve business results.
Data Visualizations and Predictive Analytics Examples
Many systems provide some form of data visualization or predictive analytics, however basic. Two stand out because you can easily integrate them into many business management systems for small and midsize companies.
The DataSelf platform offers powerful data visualizations. It offers over 5,000 reports out of the box, which you can customize to suit the user’s needs. Users of DataSelf with ERP systems such as Acumatica and Sage 100 can expect to reap significant benefits very quickly because of the easy and intuitive interface.
Velixo provides intuitive, out-of-the-box functionality as well. This software connects to Excel and offers fifty functions to transform Acumatica data into valuable reports. For companies looking for a more efficient and cost-effective way to utilize data for better decision-making, it is an excellent choice.
Stay On Top of the Trends
Assessing ERP trends can help you stay on top of the many changes in the industry and choose the features that are right for your business needs, whether you are looking to get more from your existing ERP system or tapping into the many systems that integrate with it to add additional functionality.
Contact us today to learn more about the latest trends and how they can boost your business.

