
Have you ever been asked to make a business decision based on insufficient data? Did you rely on others’ advice? Your own gut instinct? Online anecdotes? Whatever you chose, you probably wished you had data to inform your decision.
Business intelligence (BI) systems have gained widespread popularity for their ability to provide company decision-makers with relevant data. Many businesses take advantage of BI systems to create executive dashboards that present high-level measurements in a visual and understandable format.
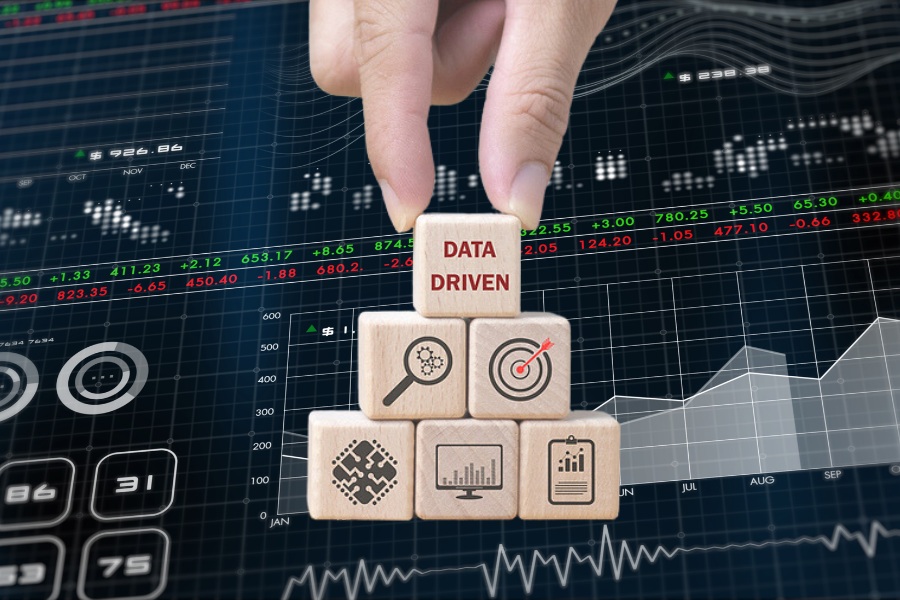
However, BI systems are capable of creating so much more than just a pretty dashboard! Read on to find out how you can leverage your BI system to make even better data-driven decisions.
Step 1: Gather Data
One of the most important features of a good BI system is its capacity to gather data from many different sources at once. Of course, your ERP should be integrated with most of your other software systems already, but data in an ERP system is organized for efficient storage and management. This organization isn’t ideal for reporting and analysis.
In addition, your BI system can likely pull information from systems that aren’t integrated with your ERP such as auxiliary systems and customer databases. A BI system centralizes this data into a data warehouse that consolidates all this data and arranges it specifically for reporting and analysis. This organization allows you to access details behind summarized indicators and detect emerging issues to resolve them as quickly as possible.
Step 2: Combine Data
If you’ve gathered your data into your BI system and it has been organized in the data warehouse, you’ve taken great steps towards better data-driven decisions. However, there are still steps you must take to best utilize this data. Next, you need to combine related data into meaningful metrics for a particular role or department. You can combine data from a wide range of data types and measures to create views for sales, purchasing, finance, accounts payable, accounts receivable, and inventory, for example. Each department will have a different set of data that they will find most useful.
Too often, BI system users will stop at this stage. You’ve created some dashboards and visualizations, so you’re done, right? In reality, there’s one more step to deeply understanding your business data.
Step 3: Analyze Data
Once you’ve decided which data is most relevant to which department, you need to analyze that data before presenting it in dashboard or report form. Don’t forget this crucial step: you must decide not only which data is relevant to which department, but how the data you’ve collected connects with your overall business goals. This is where KPIs come in. KPIs, or Key Performance Indicators, are specific measurements that relate to your company’s business goals. They can and should change over time as your company grows and faces new challenges or growth opportunities.
Take some time to strategize and analyze the data you’ve collected. What combination of data contributes to a KPI measurement? How can you display this data to get a comprehensive picture of your company’s performance on a particular KPI? If you take this extra step, you’ll be able to set up dashboards that tell decision-makers exactly what they need to know to make the best data-driven decisions possible.
ASI Can Get You Started
If you’re ready to guide your company with data-driven decisions but are overwhelmed by the process or don’t have the correct software, we’re here to help! ASI provides top-of-the-line business management solutions to help you optimize your business’s efficiency, profitability, and strategy. We can help you maximize the ROI of your BI system and put the data you need at your fingertips. Contact us or schedule a free consultation today to get started.